
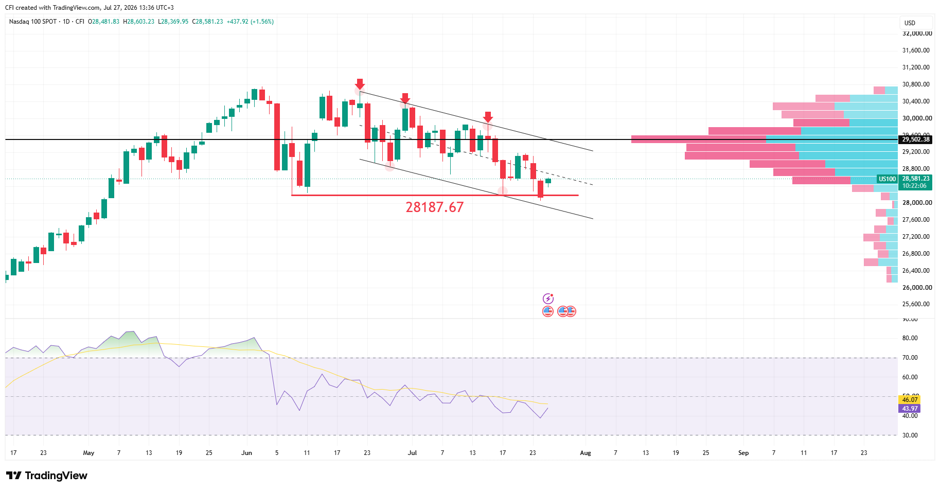
Nasdaq Tech Index, Daily Timeframe, Source: TradingView
Price action remains confined within a descending channel, with a clear and textbook technical structure: lower highs are regularly forming along the upper trendline, accompanied by repeated failed bounces. Every upward attempt has crashed directly into channel resistance and ended in failure, indicating that sellers still maintain control over the market.
28,187 Support Becomes a Crucial Level
The 28,187 level stands out as the primary market support zone. The price has tested this level multiple times during July, and each time it has attracted buyers. This recurring interaction confirms its importance as a strong structural base.
The Recent Bounce Lacks Sufficient Momentum
Following a brief breakdown of support, the price rebounded from the lower boundary of the channel and reclaimed the 28,187 level. However, the recovery remains limited, with the index trading below both the descending trendline and the key value area above.
28,187 Level Remains a Pivotal Resistance
The 29,502 level, which coincides with the Point of Control in the Volume Profile, represents a major resistance area. The largest amount of trading activity is concentrated around this level, reinforcing its role as a strong barrier against any sustainable recovery.
Volume Profile Points to Selling Pressure Above Current Price
Most trading volumes are concentrated between 29,200 and 29,800, indicating a strong area of market acceptance above the current price. Until the index manages to re-enter this zone, rallies are likely to continue facing resistance.
RSI Remains Below the Neutral Level
The Relative Strength Index (RSI) is hovering near 44, remaining below the neutral level of 50 despite the recent bounce. This indicates that momentum has somewhat stabilized but remains weak, consistent with the overall corrective structure.


0 Comments