
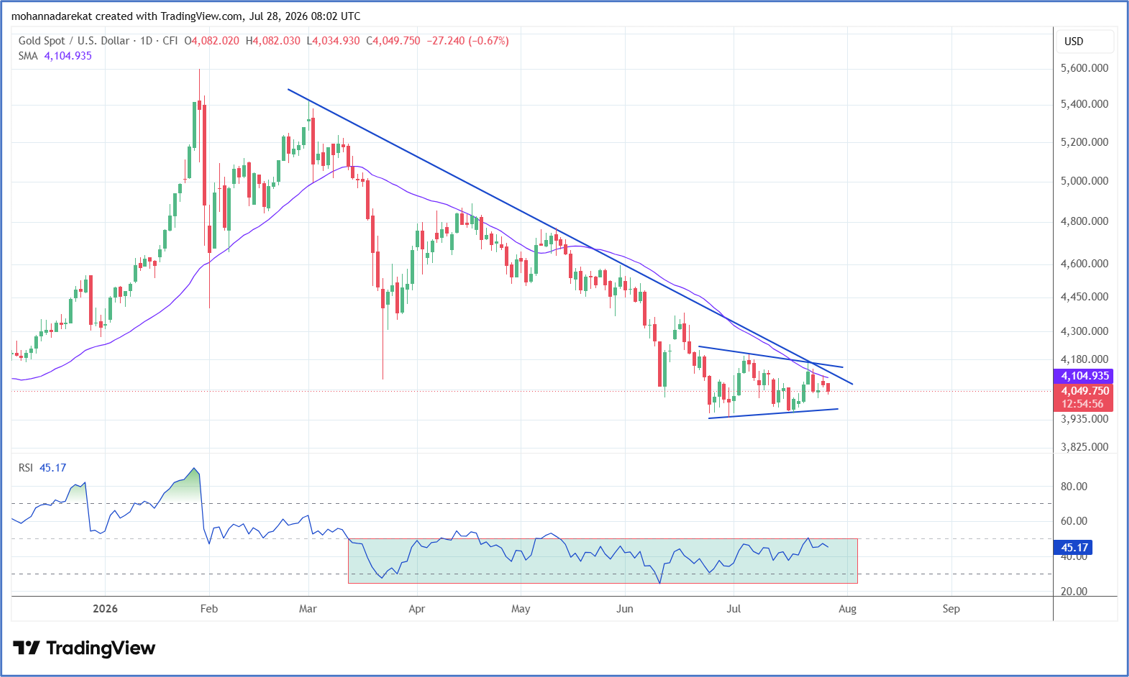
Gold vs. US Dollar, Daily Timeframe, Tool Used: 35 Simple Moving Average, Source: TradingView
Tracking gold price action through the attached chart, we find that the sideways movement continues within a triangle pattern, bounded by a resistance zone near the 4,200 level and a support zone near the 3,950 level per ounce. Today, gold is recording a decline of about 0.6%, trading near 4,050 per ounce. Several key factors are currently influencing gold price movements:
* The US dollar stabilizing near its highest level in a month, close to 101.5, ahead of tomorrow's Federal Reserve interest rate decision, with markets pricing in a 63% probability of an interest rate pause.
* Continued geopolitical uncertainty and caution, and their impact on the global economy in general and inflation in particular.
From a technical perspective, since price action is unfolding within a triangle pattern—which can act either as a continuation or a reversal pattern—the following scenarios are the most expected:
* Breaching the 4,200 resistance zone leads us to expect positive price momentum, especially as it coincides with the 35-day moving average resistance.
* Breaking the 3,950 support level points to negative price action and the continuation of the previous downward trend.


0 Comments